




On many farms, traps are checked every week and catches are noted down on paper or in an Excel sheet. Yet when it comes to treating, the decision still comes from the calendar, or from what was done last year. The numbers are there, but nobody looks at them.
For that information to be useful, it needs to be brought together in a flight curve and read correctly. The curve shows when the pest started flying, when it peaked and how many generations have already passed. With that, you can treat before the damage appears, rather than chasing it.
What a flight curve is
A flight curve brings together, week by week, the catches of adult insects of a pest over the season. Most traps use species-specific sex pheromones that attract only males. This is the method used for the European grapevine moth, codling moth or tomato leafminer. For the Mediterranean fruit fly and other pests, food attractants or coloured sticky traps are used instead.
It is worth bearing in mind that the curve measures adult activity. Damage comes later and has to be assessed separately.
What the curve shows
-
Start of flight. When catches begin to appear regularly, they mark the start of adult activity.
-
Peak of each flight. This indicates the highest mating activity. Egg-laying follows shortly after, and eggs hatch sooner or later depending on the heat.
-
Number of generations. Each rise and fall corresponds to one flight. If catches never get close to zero between two peaks, the generations are overlapping.
-
Intensity and comparison. The height of the peaks shows pest pressure and allows plots, traps and seasons to be compared. A flight higher than the previous one may indicate that the population is growing.
How to read it
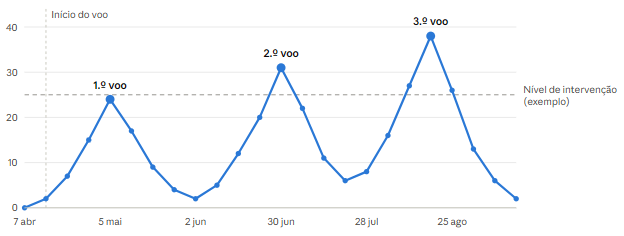
The chart below is an example with fictitious values, where each point is the number of catches per trap in one week.
- Check what is on each axis. The weeks run along the bottom and catches per trap up the left. Before comparing two curves, make sure they were built the same way: same unit, same interval between counts.
- Find where the flight starts. It is the first week from which there are catches every week. In the example, it is marked by the dashed vertical line, on 14 April.
- Count the peaks. Each peak corresponds to one flight, that is, one generation of adults. Here there are three: early May, late June and mid-August.
- Look at what lies between the peaks. When the curve drops almost to zero, one generation has ended before the next begins. If it stays high, the generations overlap and the risk period is longer.
- Compare with the reference line. The dashed horizontal line marks the action threshold, that is, the economic threshold. The first flight stays below it. The second and third cross it, and that is where a decision is needed.
- Follow the trend, not just the number. Two or three weeks in a row of rising catches already signal that a peak is coming, even before it shows on the chart.
From the curve to the decision to treat
For most pests, the damage is done by the larvae, and they only appear days or weeks after the adults fly. That is why the curve alone does not tell you when to treat. It has to be combined with other factors:
- The product. An ovicide is applied at the start of egg-laying and a larvicide close to hatching. The same peak can lead to different application dates.
- Temperature. Eggs and larvae develop faster in the heat. Degree-day models, counted from the start of flight, help predict when each stage will arrive.
- The economic threshold. Integrated Production guidelines set, for each pest and crop, the number of catches above which it is worth intervening. Below that level, treating costs more than the loss it would prevent.
Where Wisecrop comes in
In Wisecrop’s Crop Health App, pest observations can be recorded manually, from counts made in the field, or arrive automatically from integrated smart traps, such as Trapview’s. Whatever the source, the curve builds up as the data comes in, with no paper or files in between.
With catches, models and treatments in the same place, it is easier to see at the end of the season whether treatments were applied at the right time, and what to adjust the following year.