






Some crops, such as cherry, peach, apple and blueberry, need a spell of cold over winter to flower well in spring. When the chill hours accumulated fall short of what the crop needs, budbreak is uneven, flowering is delayed and yields suffer.
That count starts now, at the beginning of November. Following it through the winter, and from one year to the next, says a great deal about the orchard and the varieties planted in it.
What chill hours are
In autumn, the tree goes into dormancy. To come out of it normally in spring, rising temperatures are not enough: it first has to build up a certain amount of cold over the winter.
That amount is what chill hours measure, and it varies widely between varieties. In cherry, some varieties are satisfied with 400 to 500 hours, while others need more than 1,000. When winter cold falls short of that requirement, the effects only show months later, in spring or at harvest.
How they are counted
There is no single way of counting cold. The most widely used models are:
- Hours below 7 °C. The oldest, and still widely used, method counts every hour below 7 °C as one chill hour. It is easy to calculate, but treats an hour at 6 °C the same as an hour at -5 °C, even though at very low temperatures the tree is no longer building up useful chill.
- Hours between 0 and 7.2 °C. A variant that only counts hours within that range. It leaves out sub-zero temperatures and very intense cold, which does little or nothing to help the tree break dormancy.
- Chill units (Utah model) and chill portions (dynamic model). These give a different weight to each temperature. Temperatures around 6 to 7 °C count more, while very low ones count little or not at all. They are more demanding to calculate.
In practice, what matters most is consistency: always use the same model, and compare against the variety’s requirement measured with that same model.
What happens when there is not enough chill
A winter with little cold does not leave the tree without flowers. What happens is that it comes out of dormancy unevenly. The signs appear in spring:
- Uneven budbreak. Some buds open, others stay dormant. The tree is left with bare patches.
- Long, staggered flowering. Flowers open over a longer period, which makes pollination harder, especially in varieties that rely on another variety to pollinate them.
- Mismatch with pollinators. Flowering no longer coincides with the time when bees and other pollinators are most active, which harms flowering and fruit set.
- Flower bud drop and poorer fruit set.
- Uneven ripening. If flowering drags on, so does the harvest, and more picking passes are needed, which raises operating costs.
A weak winter can be partly offset with products that help break dormancy. But when weak winters keep coming, the problem is no longer one season: it becomes the variety that is planted.
How to read the accumulated chill curve
Chill hours are read as a running total that builds up over the winter. The chart below is an example, with fictitious values, of three winters in the same orchard.
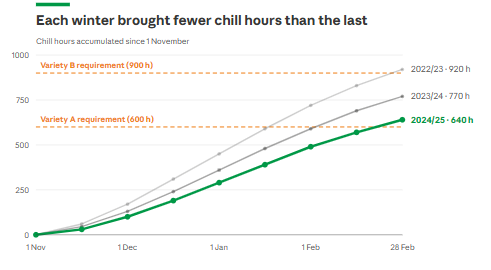
- Look at the slope. The steeper the curve, the faster cold is building up.
- Compare with the variety’s requirement. The dashed horizontal lines show how much cold each variety needs. The curve has to cross them before budbreak.
- When the curve crosses the line. The point at which the lines cross can fall at a different time each year.
- Compare seasons. A single curve tells you how one winter went. With several side by side, you can see whether winters are getting milder and whether varieties are reaching their limit.
The Cerejorange case
At Cerejorange, in Fundão, Filipe Costa grows cherries and peaches. The sensors installed on the farm track, among other things, air humidity and temperature, and are also used to calculate the chill hours of each winter. It is information he did not have before and now considers “crucial to help us make decisions”.
With several winters on record, what interests him is no longer just each year’s figure, but the trend. And that trend has been clear: a “gradual decline in chill hours” over recent years. “Without measuring it, we’re completely in the dark and can’t plan,” he explains.
Cherry is demanding in terms of chill, and some varieties have medium or high requirements for what Fundão has been accumulating. That is why Filipe uses this data mainly for medium-term planning, when he has to decide the future of a plot. The data helps him decide three things:
- When to renew. “It helps us plan better when we need to renew parts of the orchard”, whether because the trees are getting old or because the variety has reached the limit of its productive potential.
- Which variety to plant. When renewing, the choice now takes into account how much cold the plot actually accumulates.
- Whether the plot stays in cherries. In the most extreme cases, if an area is no longer suitable, the option may be to switch species, to peach, nectarine or something else.
Filipe does not see this as the end of cherries in Fundão. He points out that the issue “cuts across all cherry-growing areas” and that variety breeders are paying increasing attention to chill requirements. But to choose well among the new varieties, you need to know how much cold your own farm gets.
Where Wisecrop comes in
In Wisecrop’s Climate App, chill hours and growing degree days can be calculated from the farm’s weather station data. The values can be compared across seasons to see whether accumulated cold is rising, falling or varying from year to year.
The chill hour charts are cross-referenced with the phenological stage observations recorded in the field. So as well as knowing how much cold has built up, you can see how each plot responded. It is this link that gives the figures their meaning. After a few seasons, it becomes clear at what chill levels each variety performs on that farm, making it easier to anticipate flowering, decide whether it is worth intervening to help break dormancy and prepare the season in good time.
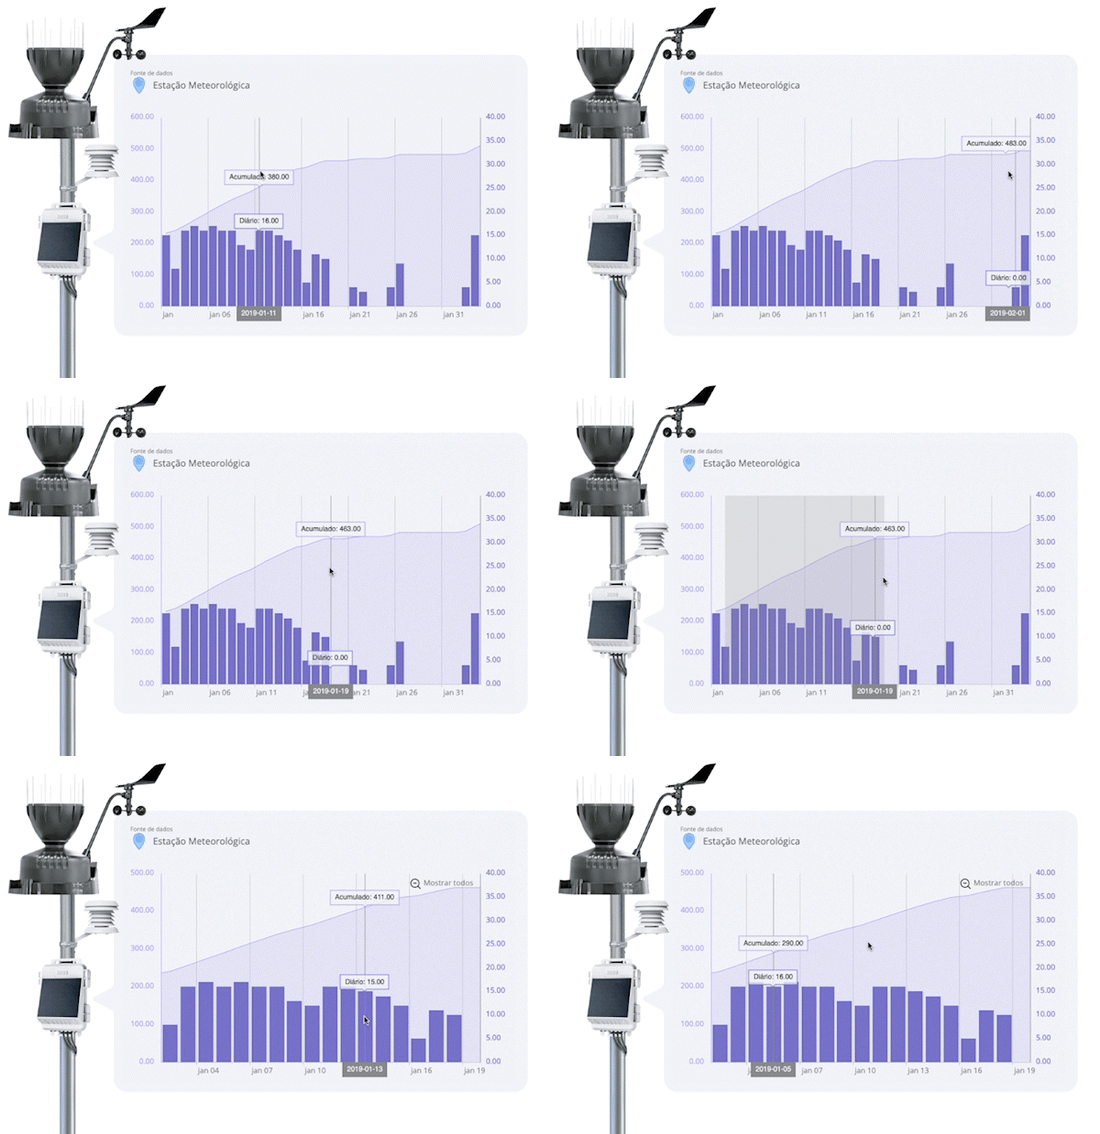 Because the data comes from the orchard itself, it reflects the farm’s microclimate rather than a regional average. And year after year, it builds a record that lets you compare the current winter with previous ones, from November onwards.